
In many organizations, project data lives in silos. Schedules are reviewed in one meeting. Cost reports are discussed in another. Risk registers are updated separately. Progress updates are shared as static reports. By the time leaders connect the dots, the project is already facing delays or budget pressure.
The problem isn’t a lack of data. In fact, modern project management systems generate enormous amounts of it.The problem is that most of this data is never transformed into actionable insight.
Why Traditional Project Reporting Falls Short?
Project managers often rely on snapshots—monthly reports, status summaries, or manually updated dashboards. While these reports provide useful information, they typically answer one question: “Where are we right now?”
What they don’t answer is:
- Where are we heading?
- What trends are forming?
- What risks are building beneath the surface?
- What will likely happen next if nothing changes?
Without analytics, decisions become reactive. Risks are identified after they have already impacted the schedule or budget. Teams spend more time reporting than managing performance.
Moving from Data to Intelligence
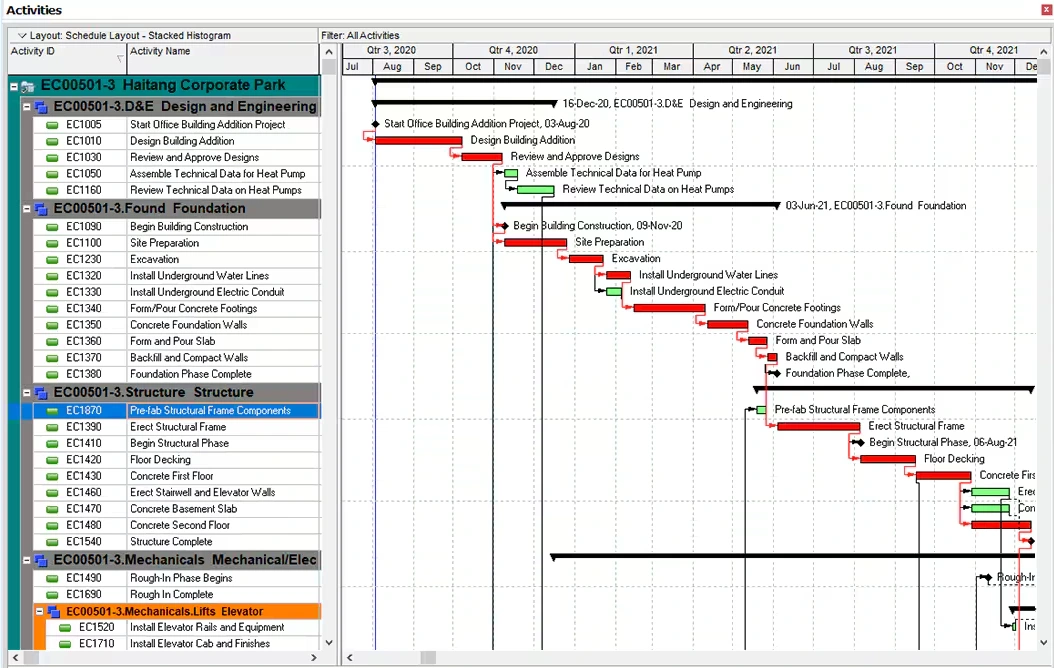
Integrating analytics into project management creates a continuous intelligence layer across planning, execution, and control. Instead of reviewing isolated reports, project teams gain a connected view of schedule, cost, risk, and performance data—all working together. This is where advanced schedule analytics plays a critical role.
Whether you are using Oracle Primavera P6, Microsoft Project, or any other scheduling platform, analytics can uncover insights that standard tracking tools often miss.
What Advanced Schedule Analytics Can Reveal
1. Early warnings for delays and cost overruns
Rather than discovering problems at the milestone review stage, analytics can highlight trends that signal future slippage before it becomes critical.
2. Root causes behind schedule slippages
Is the issue resource congestion? Poor sequencing? Low productivity? Analytics helps identify the underlying drivers—not just the symptoms.
3. Cross-project and portfolio trends
Patterns often repeat across projects. Analytics helps organizations detect systemic risks, recurring bottlenecks, and performance gaps at the portfolio level.
4. Executive dashboards with meaningful KPIs
Instead of overwhelming leadership with raw data, analytics translates information into clear, standardized indicators that support faster and more confident decision-making.
Connecting Schedule, Cost, and Risk
True value emerges when analytics connects multiple dimensions of project performance: Schedule progress, Cost performance, Risk exposure, Resource utilization, Productivity trends
When these elements are integrated, organizations gain: Real-time visibility into performance, Standardized KPIs across projects, Early-warning indicators, Predictive insights for proactive planning.
This integration shifts project management from reporting progress to actively managing performance.
The Result: Proactive, Data-Driven Delivery
With analytics embedded into project management: Decisions are based on trends—not assumptions, Risks are mitigated before they escalate, Leadership sees a clear picture of portfolio health, Teams spend less time compiling reports and more time solving problems, Most importantly, disruption is minimized. Projects no longer rely on manual intervention after issues arise. Instead, analytics provides the foresight needed to act early and steer outcomes in the right direction.
In a world where projects are becoming larger, more complex, and more data-rich, integrating analytics is no longer optional—it’s essential. Organizations that move beyond static reporting and embrace data-driven project intelligence position themselves to deliver projects more consistently, predictably, and efficiently.
If you’re ready to transform your project data into actionable insight,
now is the time to integrate analytics into your project management approach