On a day to day basis, most business functions either use spreadsheets or siloed applications. Analytics is the glue that connects different business functions.
Introducing
Project Analytics

Central Data
Centralize all your departmental data
Systems Integrated
Integrate all your existing tools, systems and processes.
Natural Language Querying
Ask questions in natural language, and get the answers you need from your data
Realtime
Real-time and interactive reports
Low code and Customizable
Completely customizable low-code application
Automation & Alerts
Automated updates and alerts defined on the KPIs
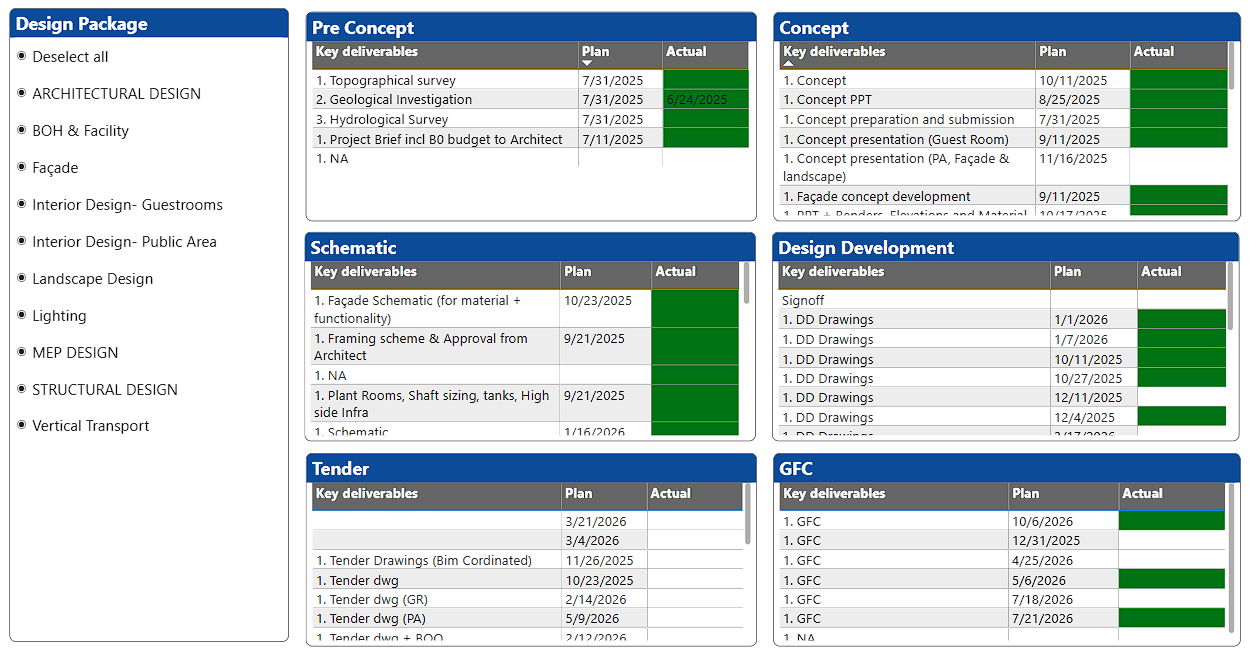
Design Development Tracking
Design Development Schedule Analysis is the process of reviewing, monitoring, and evaluating the progress of design activities against the approved design schedule to ensure timely release of drawings, specifications, and documents required for procurement and construction.
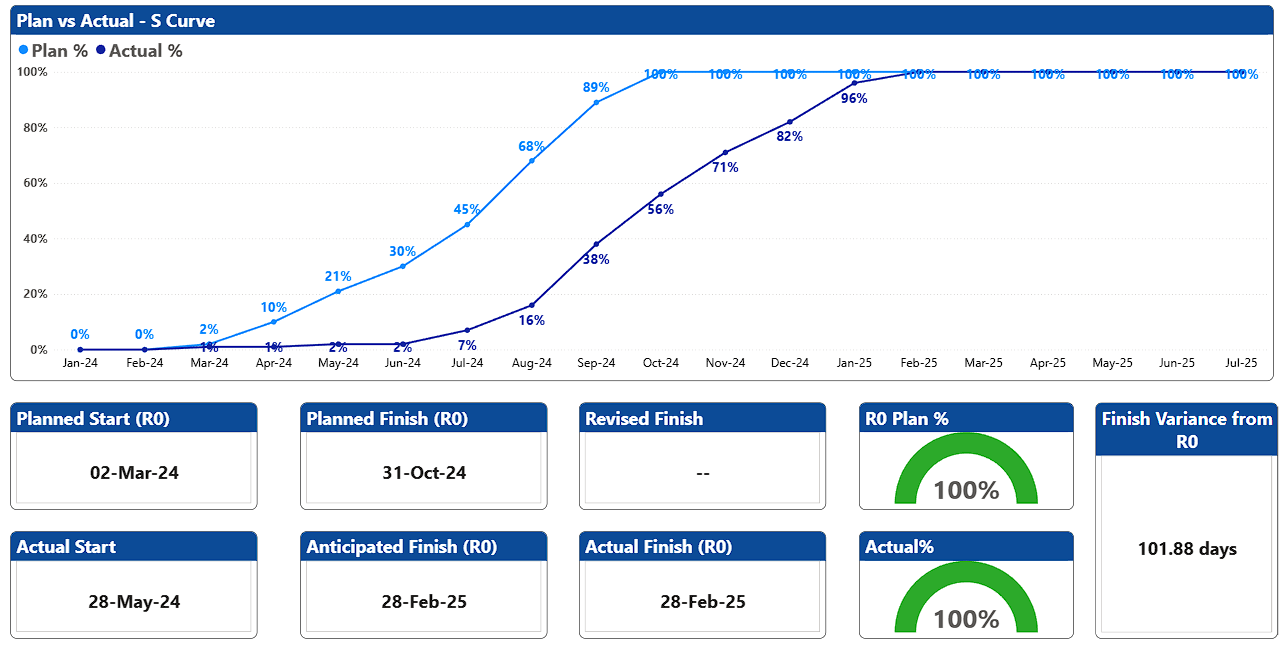
S-Curve
An S-curve is a graphical representation used in project management to show cumulative progress, cost, or resource usage over time. It is called an S-curve because the graph typically forms an “S” shape. The S-curve helps project managers identify delays, cost overruns, and performance issues early, making it a valuable tool for project monitoring and control.
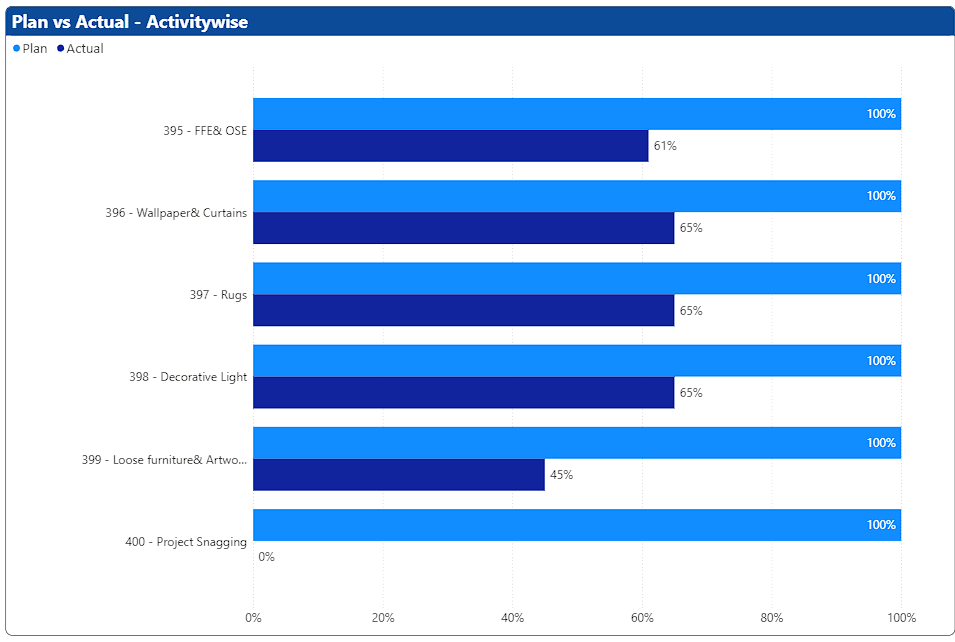
Plan vs Actual - Activity
Plan vs Actual – Activity is a comparison used in project management to measure the difference between planned activities and what is actually achieved over a given time period. Comparing plan vs actual activities helps project managers monitor progress, control schedules, and ensure timely project delivery.
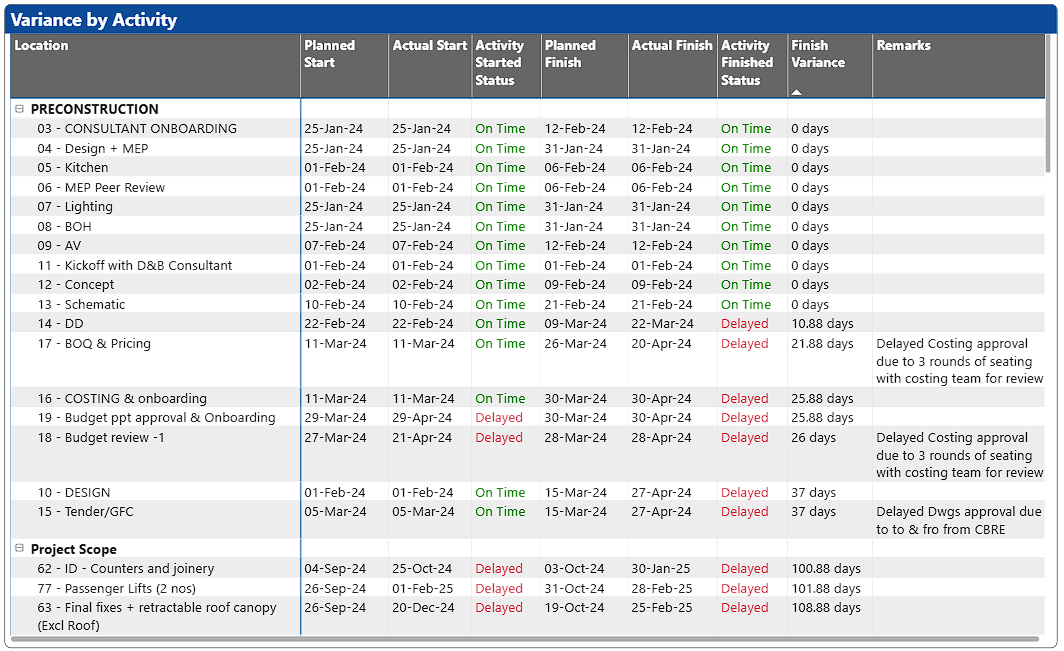
Variance Analysis
Variance Analysis is a technique used in project management to measure and evaluate the difference between planned performance and actual performance. It helps identify deviations so corrective actions can be taken. Variance analysis enables project managers to control time and cost, improve forecasting, and ensure project objectives are met.
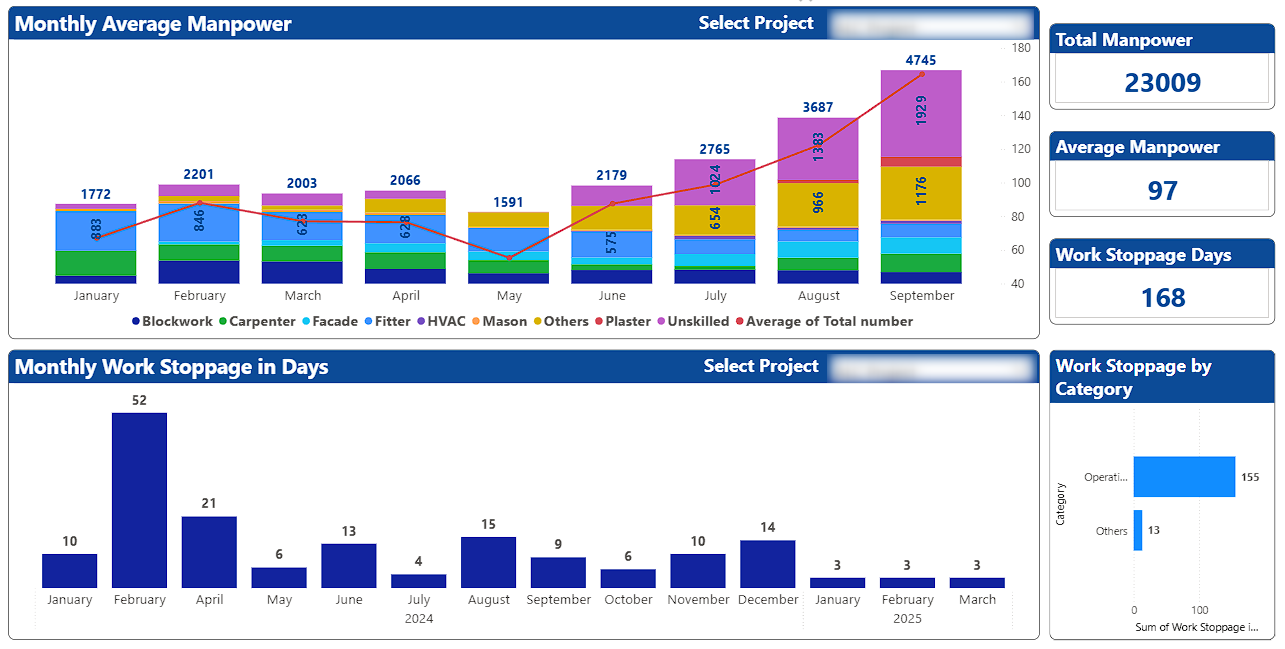
Manpower Analysis
Manpower Analysis is the process of evaluating the quantity, quality, utilization, and productivity of manpower required for a project or activity. It ensures that the right number of workers with the right skills are available at the right time. Manpower analysis helps improve efficiency, cost control, and timely completion of projects by optimizing workforce planning and utilization.
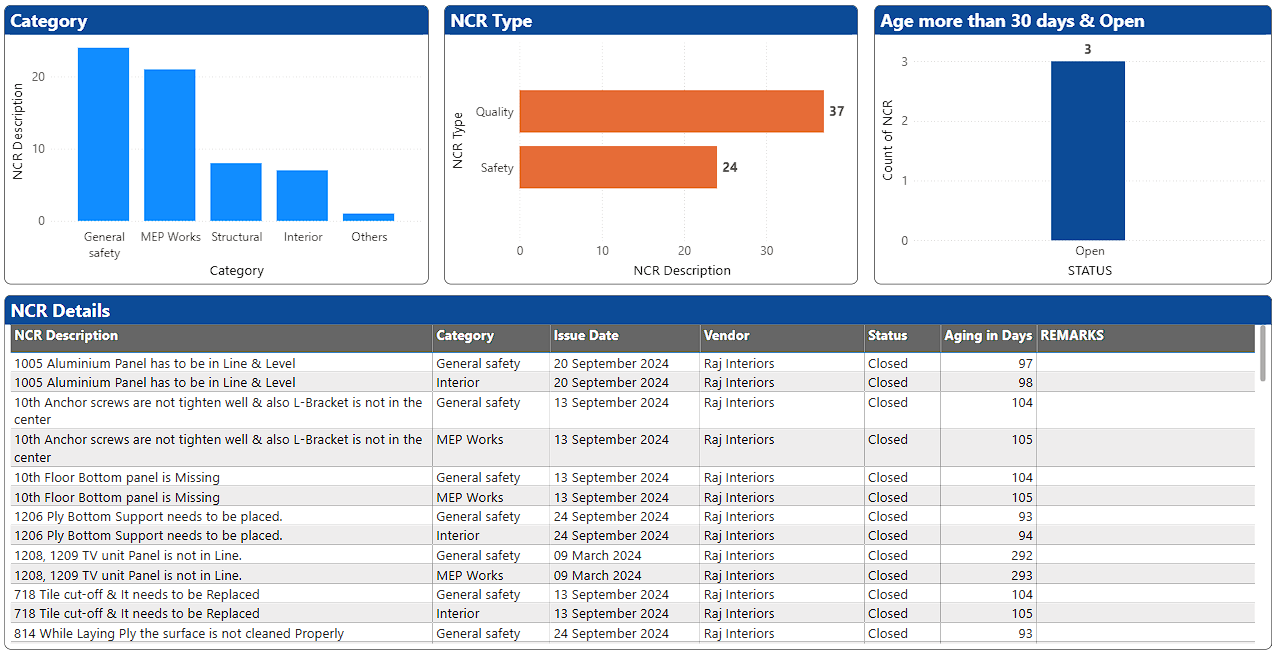
Non-Conformance Analysis
Non-Conformance Analysis is the systematic process of reviewing and analyzing non-conformances (NCRs) to identify root causes, trends, and impacts on quality, cost, and schedule, and to prevent recurrence. Non-conformance analysis strengthens the quality management system, improves compliance with standards, and ensures continuous improvement in project execution.
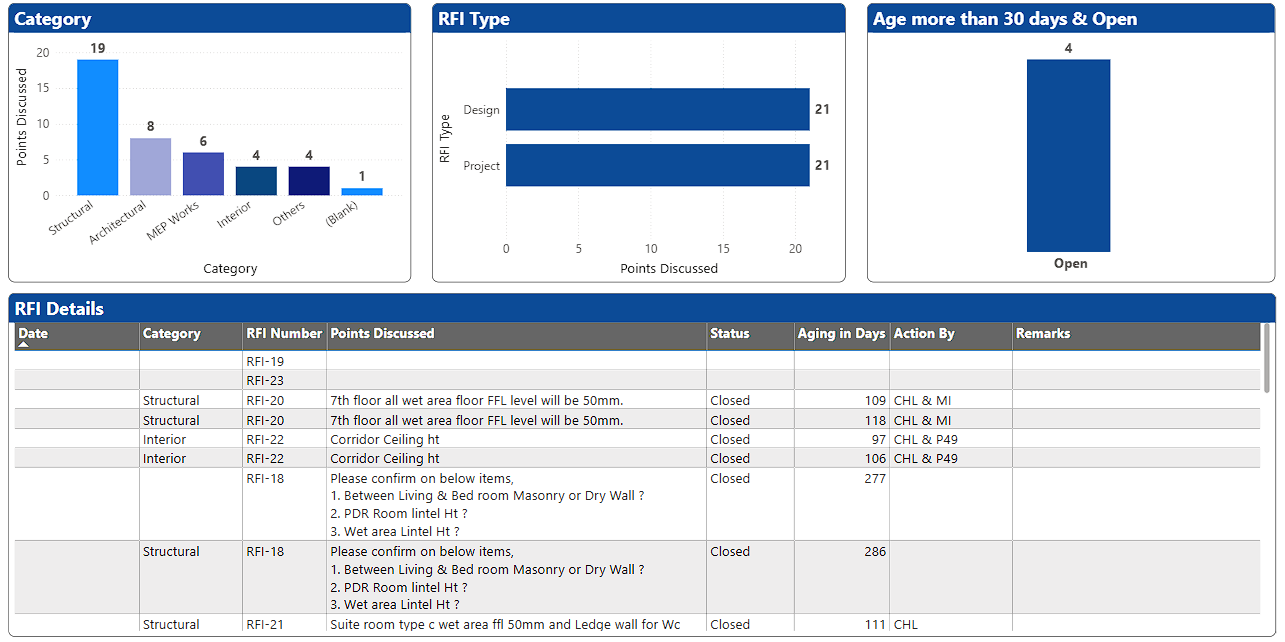
RFI Analysis
RFI Analysis is the systematic review and evaluation of RFIs (Requests for Information) raised during a project to understand causes, trends, response time, and impacts on cost, schedule, and quality. RFI analysis helps project teams prevent recurring issues, improve design quality, and enhance decision-making, leading to smoother project execution..
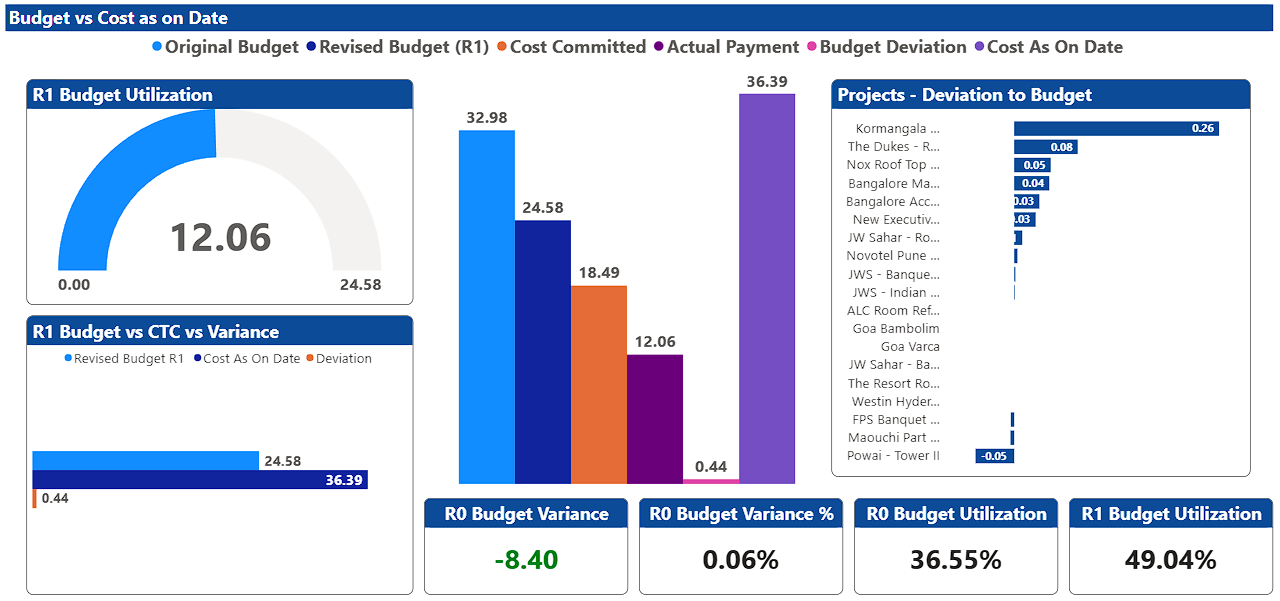
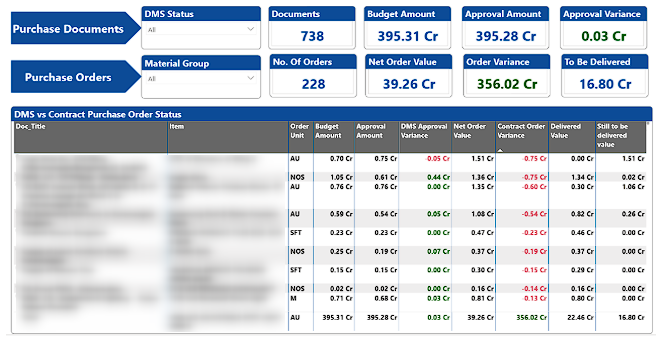
Budget vs Cost
Budget vs Cost Analysis is a cost control technique used in project management to compare the approved project budget with the actual costs incurred in order to evaluate financial performance. Budget vs cost analysis helps ensure financial discipline, enables early detection of overruns, and supports better project decision-making.
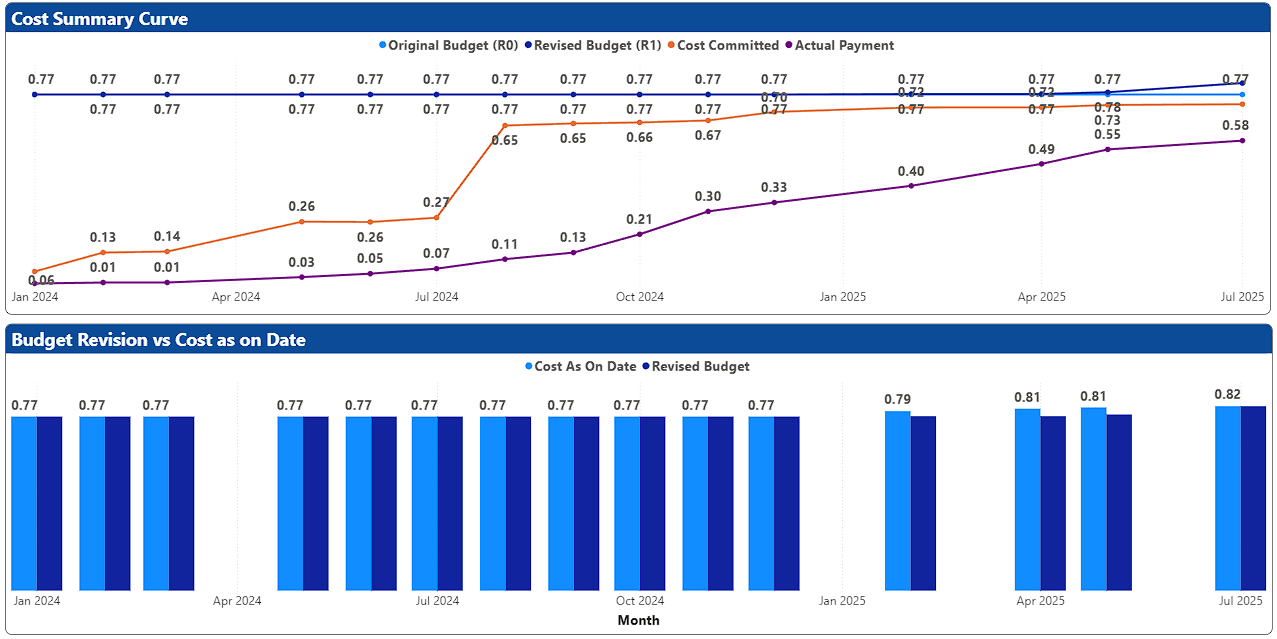
Budget vs Cost Trend Analysis
Budget vs Cost Trend Analysis is a project control technique used to track and compare the planned (budgeted) cost and actual cost over time to identify cost performance trends and forecast final project cost. This analysis helps project managers predict final cost outcomes, maintain financial control, and prevent major budget deviations before project completion.
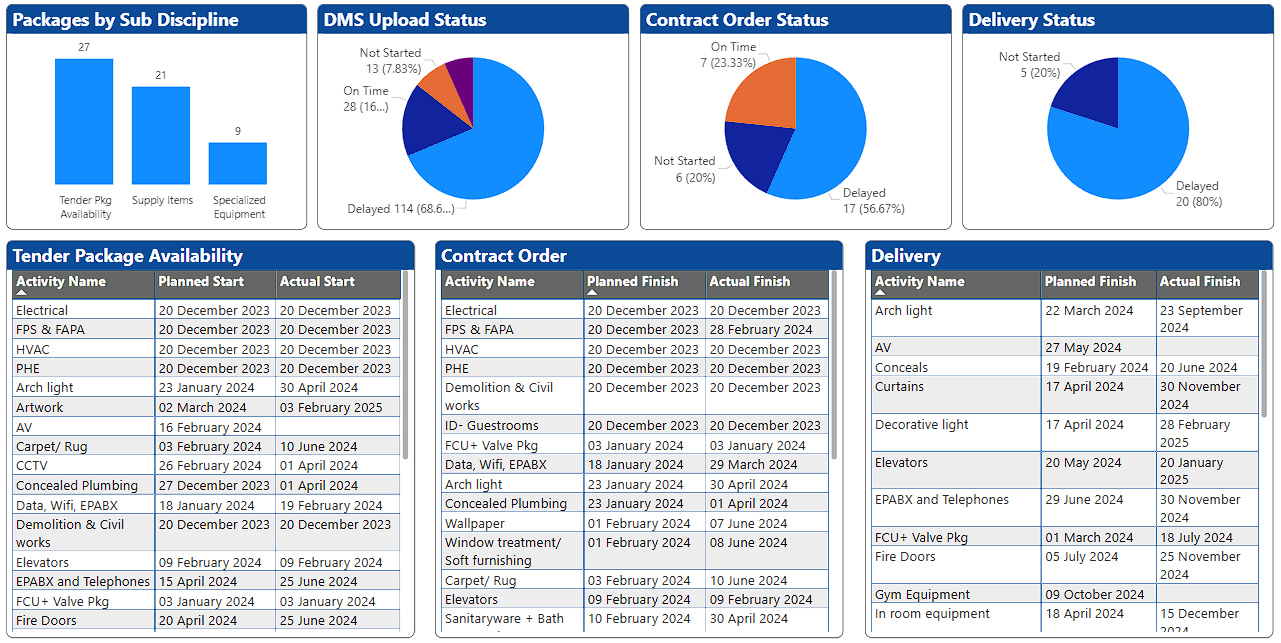
Procurement Analysis
Procurement Analysis is the systematic evaluation of procurement activities—from tendering to delivery—to assess status, delays, trends, and risks affecting project cost and schedule. Procurement analysis highlights critical delays in documentation, contract placement, and delivery, posing a high risk to project schedule.
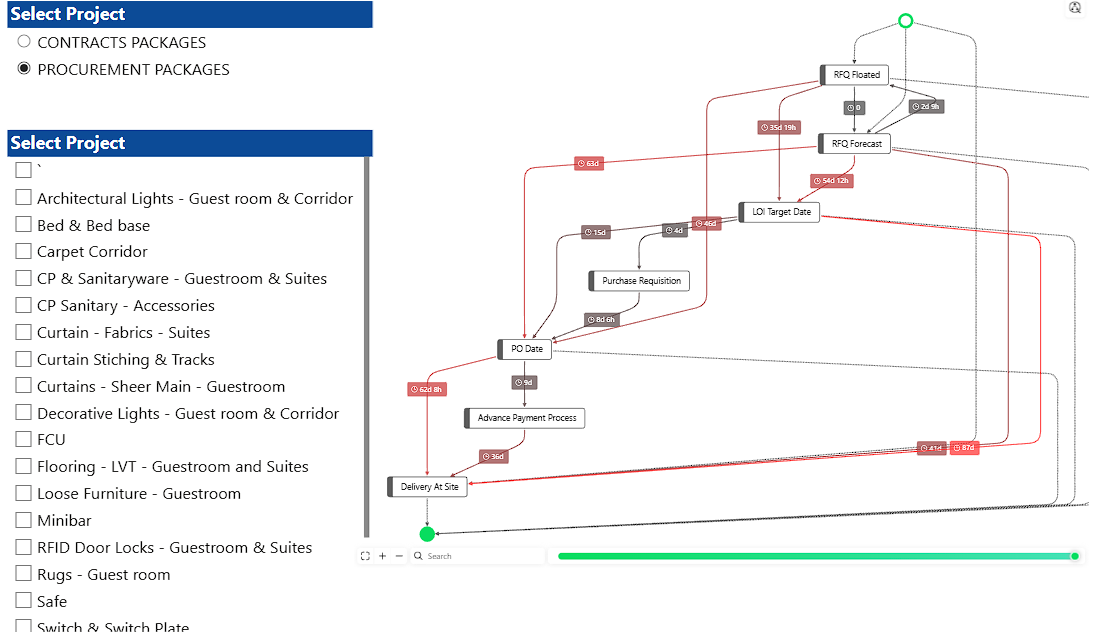
Turn Around Tracker (TAT)
Turn Around Tracker (TAT) is a monitoring and control tool used to measure the time taken to complete a process or activity from initiation to closure. It is widely used in project management, procurement, quality, and document control to track efficiency and delays.
Contract Status Analysis
Contract Status Analysis is the process of reviewing and evaluating the current status of contracts against planned milestones to assess performance, delays, and risks affecting the project. Contract status analysis helps ensure that contracts are placed and executed on time, enabling smooth procurement, timely deliveries, and uninterrupted construction progress.
Using Building Information Models?
Explore our BIM Analytics that integrates BIM, Project Management and Analytics.
Explore BIM Analytics